ROI Overlay Settings
![Placeholder Picture]()
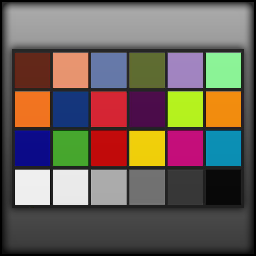
This page allows you to draw the pattern match ROI and make adjustments to the sub ROI’s for each patch in the Color Chart image. You can also draw the Refence ROI here. The pattern match ROI draws 24 color patch sub ROI’s from a single ROI, and labels are assigned to each sub ROI. If the sub ROI’s are too small are large, or the color chart orientation is incorrect you can adjust these parameters in the Color Tool Parameters Bar by adjusting the “Patch Scale” value and the sub ROIs will be redrawn automatically. You can also select the chart orientation by selecting the correct one for your image using the “Chart Orientation” control, and the labels and orientation will update automatically. The sub ROIs over the color patches should have some space between the edges of its neighbor patches. Keep the “Color Patch Scale” below 65% to eliminate overlapping of regions. You can add a reference ROI drawn over the background to calculate the reference color values and these values are returned via the report output. Select “Reference” from the “Select ROI” control to draw the reference ROI.
Measurement Configuration
The Color Configuration controls in the Parameters Bar configures the measurement setup and “Color Rendition Chart” shown in the picture window to show a side by side view of the color patch mean value compared to a reference file containing a list reference values for 24 color patches. The display colors are shown as RGB values but the L*a*b* values are also calculated which requires a White Reference values, and a Coefficient Group values used in the color space conversion math. You have many options for the color patch comparison by showing image over reference file 1 or reference file 2 and all combinations of each.
Color Measurements
The Measurements tab shows the color measurements as you hover the cursor over a color patch, the RGB, L*a*b*, and Delta values are displayed. This displays both the Upper Left and Lower Right color of the color patch if more than one item is selected per color patch from the “Color Patch Location” control.
Export Measurements
You can export the measurement data from all color patches with many options to include all of the measurements available and the format of the data. The Export Options dialog shows a preview of the data as it would appear in the file. Right Click the data preview window and select show "Description and Tip.. to view the addtional file information. "You can also export the Color Rendition Chart as an image file.